

TravelingForMiles.com may receive commission from card issuers. Some or all of the card offers that appear on TravelingForMiles.com are from advertisers and may impact how and where card products appear on the site. TravelingForMiles.com does not include all card companies or all available card offers.
In the middle of last week, the hammer that most World of Hyatt fans have been dreading finally fell and Hyatt unveiled the effects of its new award charts. Out are the simple 3-season award charts which were (mostly) set in stone and in are the new 5-season award charts which, we’re told, will change (to one degree or another) during the year.
So, what does the cost of standard room World of Hyatt awards look like now that the new award charts are in place and how does this compare to what the same awards cost in the halcyon days before 20 May? Well, I’ve attempted to check.
Warning: There are a lot of number in this article, so if numbers aren’t your thing, this may not be an article for you.
What I’ve done
At the end of February, on the day that Hyatt announced it was overhauling its award charts and promptly gave a significant number of World of Hyatt members more cause for anxiety than an IRS audit, a house purchase, and a prostate exam all rolled into one, I took a few screenshots. Actually, I took a lot of screenshots.
What I captured were the award availability calendars for fourteen World of Hyatt properties, and what I was left with was a record showing every date on which a standard room award was available (at my chosen properties) and the cost of each available award.
As we moved from February through March, April and then into May, I took further screenshots when the award calendars rolled forward and started to show what was available in March, April and May 2027.
By devaluation day (20 May 2026) I had screenshots showing a snapshot of award availability and award costs from March 2026 through to the end of May 2027.
When the World of Hyatt devaluation hit and the new award calendars were loaded, I revisited the same properties and, again, took screenshots showing the cost and availability of standard room awards for June 2026 to May 2027 for each property.
This gave me a before and after picture of award availability and cost at the properties I had selected. What follows is a look at some of the data I’ve extracted from all of these screenshots.
A couple of disclaimers (of sorts)
I’m not about to claim that anything you’ll see in this article can be viewed as statistically significant because the sample size I’ve used is far too small, but I still think the data gives an insight into what Hyatt has done and how things have changed (or not changed as the case may be).
It’s also worth keeping in mind that by their very nature, the screenshots that I took in the months leading up to the devaluation are just snapshots in time. They only show the award availability at the very moment the screenshot was taken, so because award availability is changing all the time, the screenshots do not always allow for an exact pre and post devaluation comparison, but they still do a good job.
The data
The first thing that I noticed as I was comparing the pre and post devaluation numbers was how infrequently I was seeing the new “upper” and “top” seasons being used.
It’s almost as if Hyatt (and/or the individual properties) is/are being deliberately careful not to make awards ridiculously expensive too soon in the post devaluation era.
Here’s a table showing what I mean.
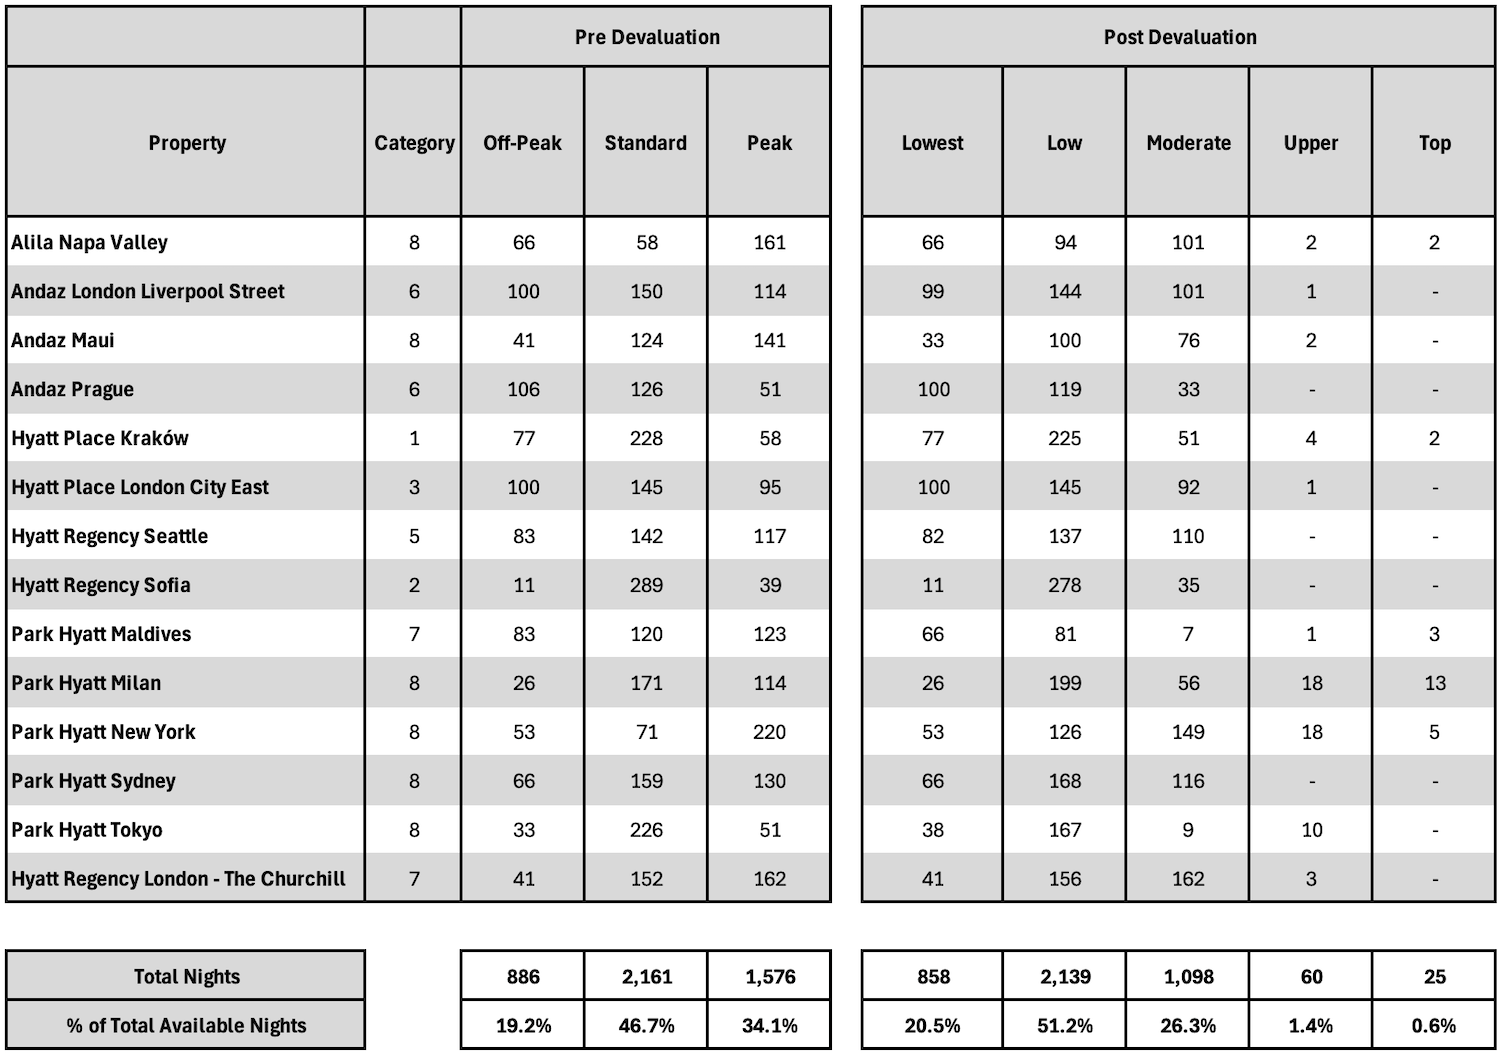
Post devaluation, only 2% of the available award nights being offered by the properties that I selected are priced at “upper” or “top” season prices.
And it’s worth noting that a number of the properties that I included in my sample are what most World of Hyatt fans will recognise as top-tier/aspirational properties where award pricing has, traditionally, been very high.
The worst “offending” property in this table is the Park Hyatt Milan, but even that property has only classified 10% of all it’s currently available standard room award nights as “upper” or “top” season (31 nights out of 312 nights).
The Park Hyatt New York which, in my opinion is one of the most overpriced properties in the entire Hyatt portfolio, has only designated 6.5% of its currently available standard room award nights (23 nights out of 351 nights) as “upper” or “top” season.
This is more than a little surprising.
Another thing that comes out of the data that I’ve been looking at is that Hyatt appears to have mapped the old seasons to the new seasons in a surprisingly consumer-friendly way.
At a lot of the properties that I chose, this is what the mapping looks like:
- Off Peak Season (old) -> Lowest Season (new)
- Standard Season (old) -> Low Season (new)
- Peak Season (old) -> Moderate Season (new)
You can see this, to a degree, in the table above, but it’s even clearer when you see how some of the screenshots compare.
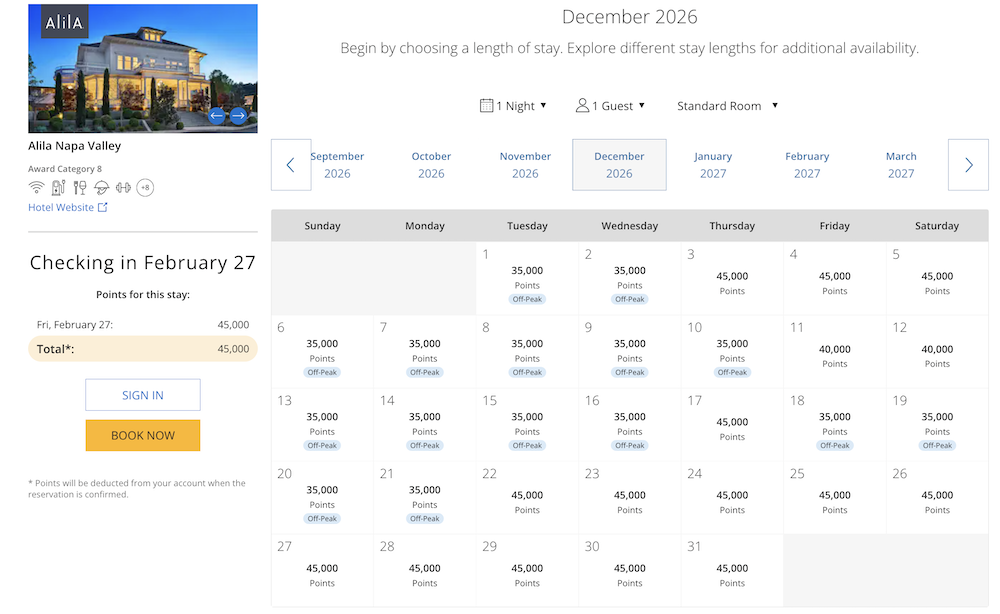
Here, for example is a screenshot of award availability at the Alila Napa Valley for December 2026 as taken pre devaluation:
And here’s a screenshot taken post the award chart devaluation showing award availability for the same month:
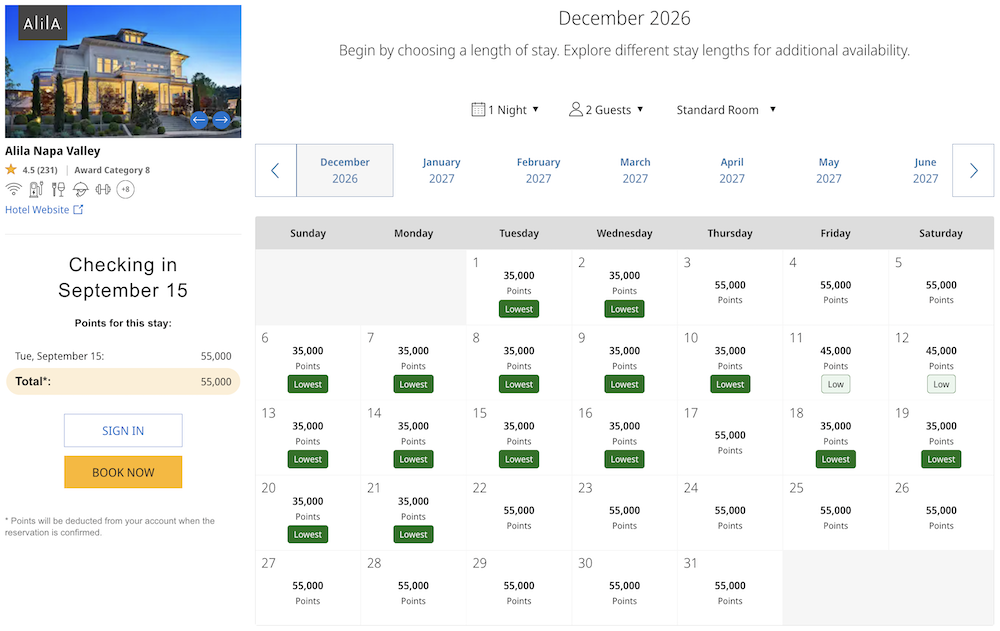
The off-peak, standard, and peak dates from the pre devaluation screenshot map exactly to the lowest, low, and moderate dates on the post devaluation screenshot.
Importantly, this doesn’t seem to be a one-off occurrence or an exception. There’s plenty of evidence (from the properties that I selected) that this is happening elsewhere as well.
The January, March and April screenshots for the Alila Napa Valley also map exactly.
The screenshots from November 2026 through to April 2027 for the Andaz London Liverpool Street map perfectly.
The screenshots from July to November 2026 for the Hyatt Place Kraków map perfectly.
And, to give one more example, the screenshots from November 2026 through to February 2027 for the Hyatt Regency Seattle are also examples of perfect mapping.
This is unlikely to be a coincidence.
Interestingly, in a few rare instances, Hyatt appears to have taken the idea of “treading gently” with the new award prices to a degree that I wasn’t expecting to see.
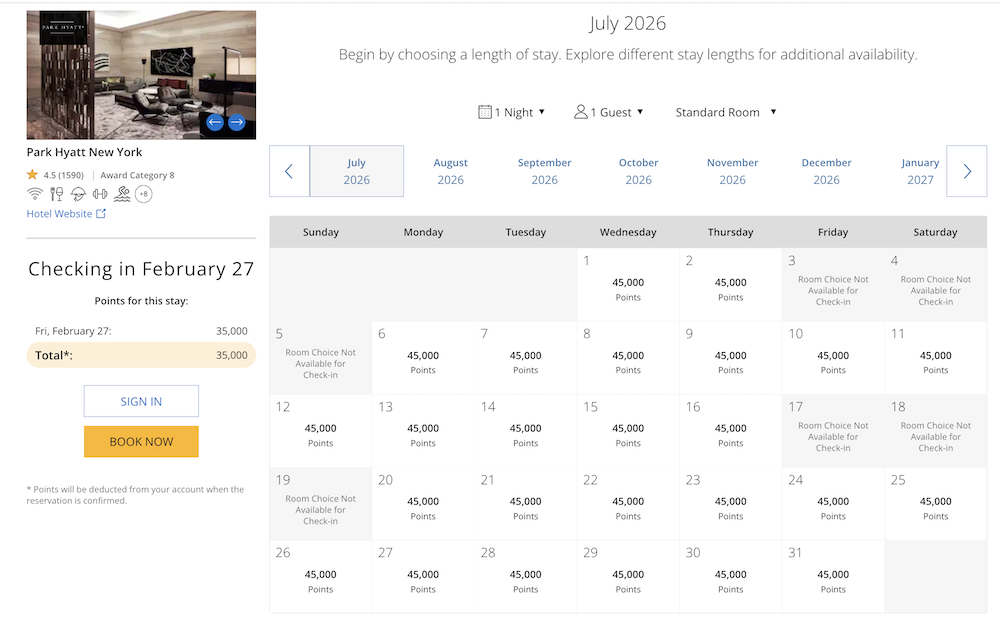
Here, for example is a screenshot showing July 2026 award availability at the Park Hyatt New York taken before the devaluation:
And here’s a screenshot showing the same data after the award chart changes had kicked in:
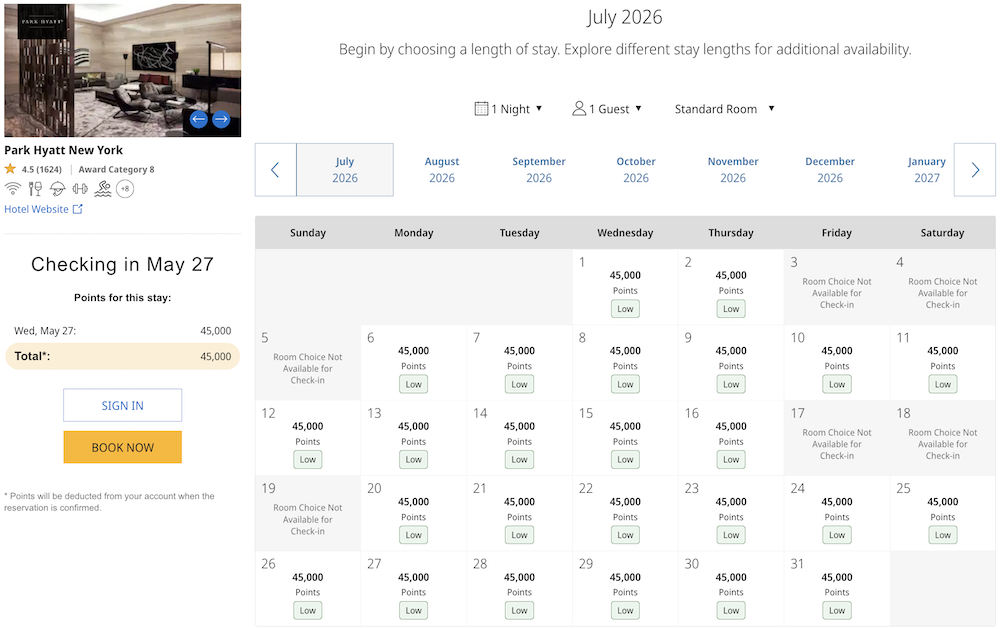
As you should be able to see, the cost of awards in July 2026 hasn’t changed at all, and that’s because the old Peak Season dates have been mapped to the new “Low Season”.
That’s not what most of us thought that we would see when we got our first look at the post devaluation data.
Still, as nice as it is to see some evidence that Hyatt appears to be going easy on us in the first days following the introduction of the new award charts, the seasons into which dates have been placed aren’t the thing that most World of Hyatt fans are interested in.
The cost of awards is what matters most, so what does the data show there?
Well, this was the the information I was most keen to look into as it’s all very well Hyatt not pushing many nights into the upper and top seasons, but that wouldn’t mean very much if the cost of booking awards had still increased dramatically – don’t forget that the new “moderate” season pricing is higher than the old “standard” season pricing for all properties, and its higher than the old “standard” and “peak” season pricing for properties in Category 8.
For the 12 properties in my sample which did not move up or down an award category, this is what the data shows:
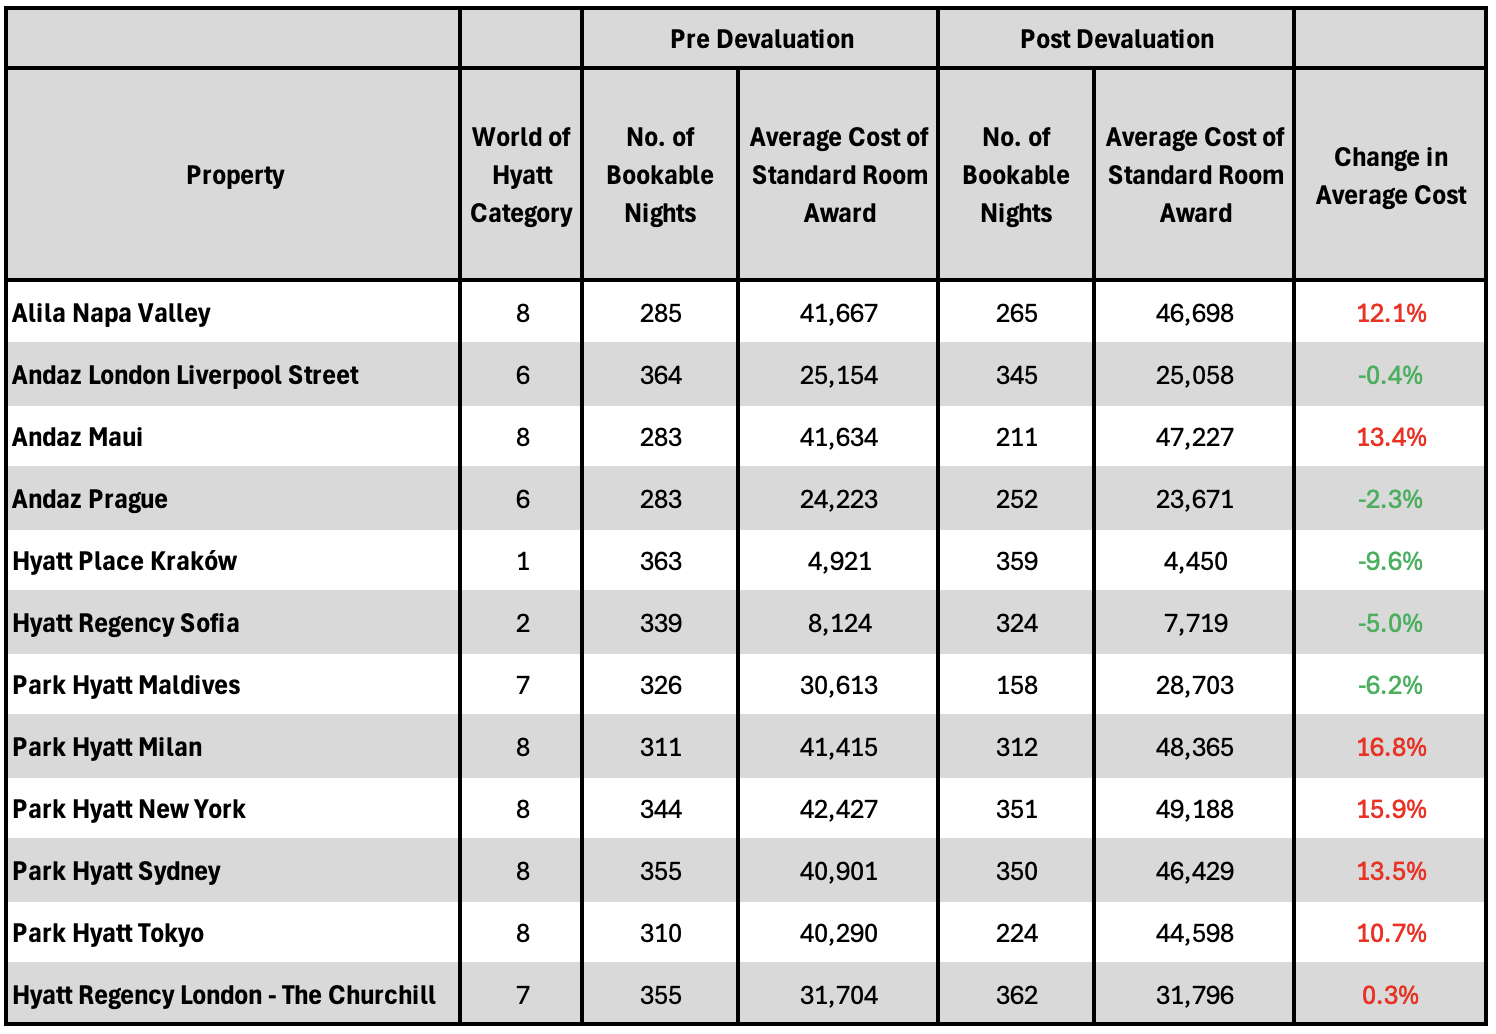
Note: I’ve shown the number of bookable nights for each property as averages and percentages mean less and less the smaller the sample size gets.
The change in average price of an available standard room award at the properties in my sample is +4.9% and it’s the Category 8 properties that are driving this increase.
If you exclude the Category 8 properties, the change in average price of an available standard room award is -3.9%.
For most properties shown in the table above, the number of bookable nights pre devaluation and post devaluation is relatively comparable (the Park Hyatt Maldives and the Park Hyatt Tokyo being the more notable exceptions), so in the absence of any other data, it would have been surprising to see some of the averages decreasing.
The data, however, makes perfect sense when you consider how Hyatt has mapped the seasons and when you consider the properties that I have in my sample.
All but one of the properties in my sample whose average award price has increased are in Category 8, and as I noted earlier, the cost of “low” and “moderate” season awards at a Category 8 property (per the new award charts) is higher than the cost of an “off-peak” or “standard” season award under the old award chart:
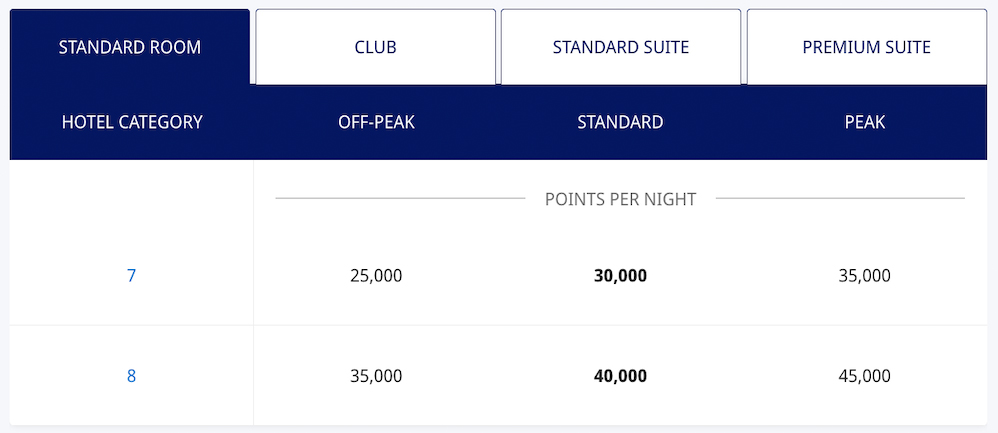
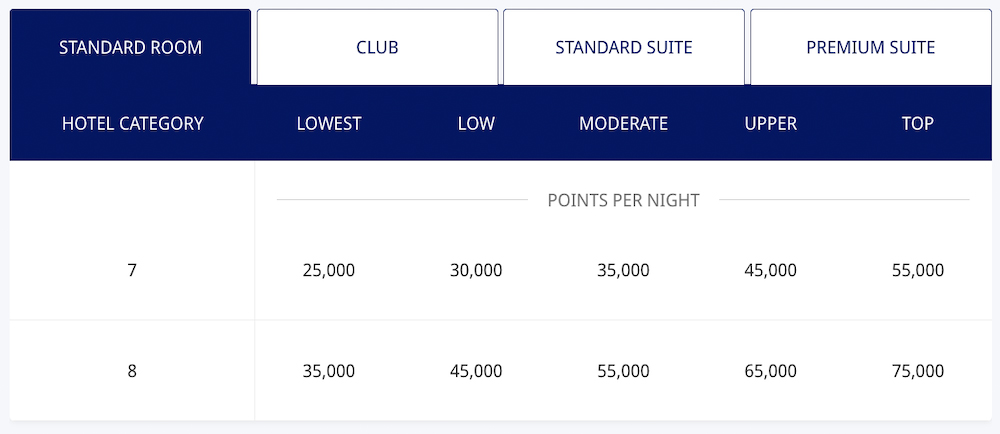
With that in mind and remembering that Hyatt looks to be mapping the old standard season to the new low season, it would be odd if the data didn’t show the average award cost of a standard room at a Category 8 property to be increasing.
Likewise, my data shows drops in the average cost of a standard room award at properties in Categories 1 through 6, and that’s down to how Hyatt has done its season mapping.
At a Category 2 property, for example, this is what the season mapping appears to look like:
- Off Peak (6,500 points) -> Lowest (6,000 points)
- Standard (8,000 points) -> Low (7,500 points)
- Peak (9,500 points) -> Moderate (10,000 points)
So with Hyatt yet to unleash the full horror of “upper” and “top” season pricing, it’s not surprising to see the average cost of a standard room award decreasing at Category 2 properties.
If you take a look at the two Category 6 properties in my sample, neither shows much of a change in the average cost of awards (-0.2% and -2.3%) and again, this is down to how the season have been mapped:
- Off Peak (21,000 points) -> Lowest (20,000 points)
- Standard (25,000 points) -> Low (25,000 points)
- Peak (29,000 points) -> Moderate (30,000 points)
Sure, the 2.3% decrease in the average cost of an award at the Andaz Prague looks a little odd (it’s a slightly larger movement than I’d expect given how closely aligned the award pricing is), but the data shows this is down to the mix of seasons on offer (pre devaluation 106/126/51 off peak/standard/peak & post devaluation 100/119/23 lowest/low/moderate).
Two properties moving categories
What I’ve been discussing so far has only been data from properties which have remained in the same award category as they were before the devaluation as that’s about as close to a like-for-like comparison as I can make.
I do, however, have some data for two properties which moved categories, and this is what that data looks like:
Hyatt Regency Seattle (Category 4 to Category 5)
Pre devaluation key data:
- Property was in Category 4
- Award nights cost 12,000/15,000/18,000 points (off-peak/standard/peak)
- Off peak season nights – 83
- Standard season nights – 142
- Peak season nights – 117
- Average cost of an available award night – 15,298 points
Post devaluation key data:
- Property now in Category 5
- Award nights cost 15,000/20,000/25,000/30,000/35,000 points (lowest/low/moderate/upper/top)
- Lowest season nights – 82
- Low season nights – 137
- Moderate season nights – 110
- Upper season nights – 0
- Top season nights – 0
- Average cost of an available award night – 20,426 points
That’s an increase of 33.5% in the average cost of an available award night.
As a standalone number, it’s hard to know what to make of this 33.5% increase as two variables have changed (the hotel category, and the award charts), so it’s not clear which variable is making the most difference.
Let’s, therefore, imagine that the property didn’t change award categories and that we’re only dealing with the award chart changes.
This is what the data would have looked like under those conditions:
- Property still in Category 4
- Award nights cost 12,000/15,000/20,000/22,500/25,000 points (lowest/low/moderate/upper/top)
- Lowest season nights – 82
- Low season nights – 137
- Moderate season nights – 110
- Upper season nights – 0
- Top season nights – 0
- Average cost of an available award night – 15,924 points
Had the Hyatt Regency Seattle not moved up an award category, the average cost of a standard room award at this property would have increased by just 4%, so the principle driver for the big increase in award price at the Hyatt Regency Seattle is the category change and not the changes to the award charts.
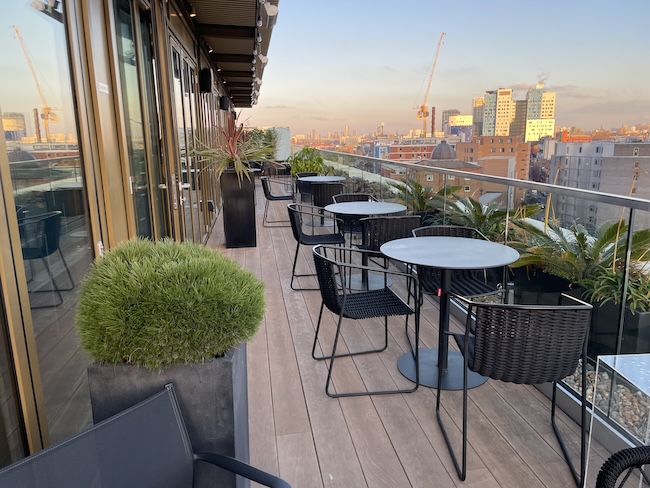
Hyatt Place London City East (Category 4 to Category 3)
Pre devaluation key data:
- Property was in Category 4
- Award nights cost 12,000/15,000/18,000 points (off-peak/standard/peak)
- Off peak season nights – 100
- Standard season nights – 145
- Peak season nights – 95
- Average cost of an available award night – 14,956 points
Post devaluation key data:
- Property now in Category 3
- Award nights cost 15,000/20,000/25,000/30,000/35,000 points (lowest/low/moderate/upper/top)
- Lowest season nights – 100
- Low season nights – 145
- Moderate season nights – 92
- Upper season nights – 1
- Top season nights – 0
- Average cost of an available award night – 11,649 points
That’s a decrease of 22.1% in the average cost of an available award night.
As was the case for the Hyatt Regency Seattle, it’s hard to know what to make of this decrease given two variables have changed, so let’s imagine that the property didn’t change award categories and that we’re only dealing with the award chart changes.
This is what the data would have looked like under those conditions:
- Property still in Category 4
- Award nights cost 12,000/15,000/20,000/22,500/25,000 points (lowest/low/moderate/upper/top)
- Lowest season nights – 100
- Low season nights – 145
- Moderate season nights – 92
- Upper season nights – 1
- Top season nights – 0
- Average cost of an available award night – 15,496 points
Had the Hyatt Place London City East Seattle not moved down an award category, the average cost of a standard room award at this property would have increased by 3.6%.
Once again we can see that it’s the change in hotel category and not the change in the award charts that’s doing the heavy lifting when it comes to the change in average cost of an available award night as the Hyatt Place London City East.
Final thoughts
As I said at the very beginning, my sample size is far too small for me to be able to say that any of my data is statistically significant, but given that working with the 300+ screenshots that I have was more than enough for me, I’m left to make what observations and extrapolations I can from the data I have.
You are more than welcome to disagree with me as much as you like as I don’t have a statistical leg upon which to stand 🙂
So this is what I think.
I think that, within reason, regardless of what properties I had selected, I would now be seeing evidence that Hyatt has (mostly) mapped the old off-peak, standard, and peak seasons to the new lowest, low and moderate seasons.
It’s unlikely that I’ve accidentally picked 14 properties where to a greater or lesser degree there’s good evidence for this.
As a result, if I had all the award availability data available pre and post devaluation, and if I removed all the Category 8 properties from that data, I suspect that I would probably see only a small difference between the average cost of awards pre and post devaluation.
More importantly, that difference may even show a slight decrease in the average cost of awards.
Given what information we had before 20 May, and given all the speculation that was swirling around in the weeks leading up to the award chart changes, this is surprising.
Where are all the ridiculously priced awards? Where are the properties at which not a single date can be booked for under 65,000 points/night?
Was all the doom mongering over done? Were a lot of us (me included) far too pessimistic when assuming what the changes would mean?
Possibly. But probably not.
Hyatt didn’t make huge changes to its award charts just to increase the average cost of award nights at a handful of properties (mostly Category 8 properties). And it certainly didn’t push through the changes to allow us to book awards at less than we were paying before, so what’s going on?
Well, the answer which makes the most sense to me is that this is just the first salvo from Hyatt. This is just the start, and there’s still a lot more to come.
I’m reasonably sure that Hyatt is being clever here and playing a medium- or long-term game.
When the news first broke that the old award charts were being ripped up and new award charts were being introduced, it looked like the sky was falling in on the World of Hyatt and that the program was about to become a lot, lot, worse.
So what Hyatt appears to have done is to, carefully and very deliberately, made the opening effects of the changes to World of Hyatt award charts as benign as it possibly could.
Sure, a lot of people are still complaining, but a lot of people are also now saying how the results of the award chart changes are not nearly as bad as we once feared. And they’re right, because they’re not.
What we can see in the award availability charts right now clearly shows that the changes have not brought about “Hyattmageddon”. At least not yet.
And the “not yet” bit is the key thing to remember.
We know that Hyatt plans to let individual properties have a lot more say in what their award calendars look like, and we know that the calendars are now no longer fixed once they’ve been published (so a date on which a standard room currently costs 25,000 points may, in a few weeks’ time, show a standard room costing 30,000 or 35,000 points if a property sees demand for that date surging), so I don’t think we’ve yet seen the full picture.
In fact, I think we’ve barely scratched the surface.
What we’re now seeing is what Hyatt wants us to see – a nice gentle transition to a new set of award charts that are not in any way as horrible as we thought they would be.
Given time, however, these award availability charts will evolve and I don’t expect them them to evolve in a way that’s favorable to most World of Hyatt members.
There is no doubt in my mind that as we move into next year and as new months become bookable, we’ll start to see more and more properties making the most of the two top-level seasons which are almost being ignored right now.
As the months go by, I expect to see the average cost of awards increase gradually and at a rate that doesn’t really draw the attention of most World of Hyatt members (the boiling frog effect as some have been calling this tactic).
Those of use who are deeply immersed in the miles and points world may notice the changes as they come, but we’re only a very small subset of the overall population of people who use the World of Hyatt program, so Hyatt can probably live with that.
For most people, the World of Hyatt changes don’t look too bad right now, so it will only be when they take one of their very infrequent looks at the award availability calendars in a year or two years’ time and see that every available standard room award at the Park Hyatt New York “suddenly” costs at least 65,000 points and that every available standard room award for a weekend stay at the Alila Napa Valley “suddenly” costs 75,000 points, that they’ll realise that what we’re seeing now is just the beginning.
Hyatt is just getting started, and I still believe that what’s coming will be painful, so don’t be fooled by what the World of Hyatt award chart changes look like right now because there’s still no reason to believe that the purveyors of doom were wrong.
















Now do Andaz Costa Rica. Started at 20K, dropped to 15K(after a slow start, I guess. That was simply the best ever use of the Hyatt card free Cat 4 nite cert), then 25K, then 45K, now with current deval it’s 55K(all peak season awards)! It’s a nice hotel but it ain’t a Cat 8.
This hotel now has the potential(as your article speculates with later increases) to go to 75K! That’s insane.
Yes, it’s only one property but I suspect several Cat 8’s(PH Vendome etc..) will rapidly make their way towards the upper(for now) limit.